
Sustainability
Reports With Rigor
Editorial design for sustainability and ESG reports: dense disclosure data, clear charts, and a narrative that reads as credible rather than promotional.
Selected Clients
Reporting and editorial work for companies and institutions





Reporting &
Editorial Work

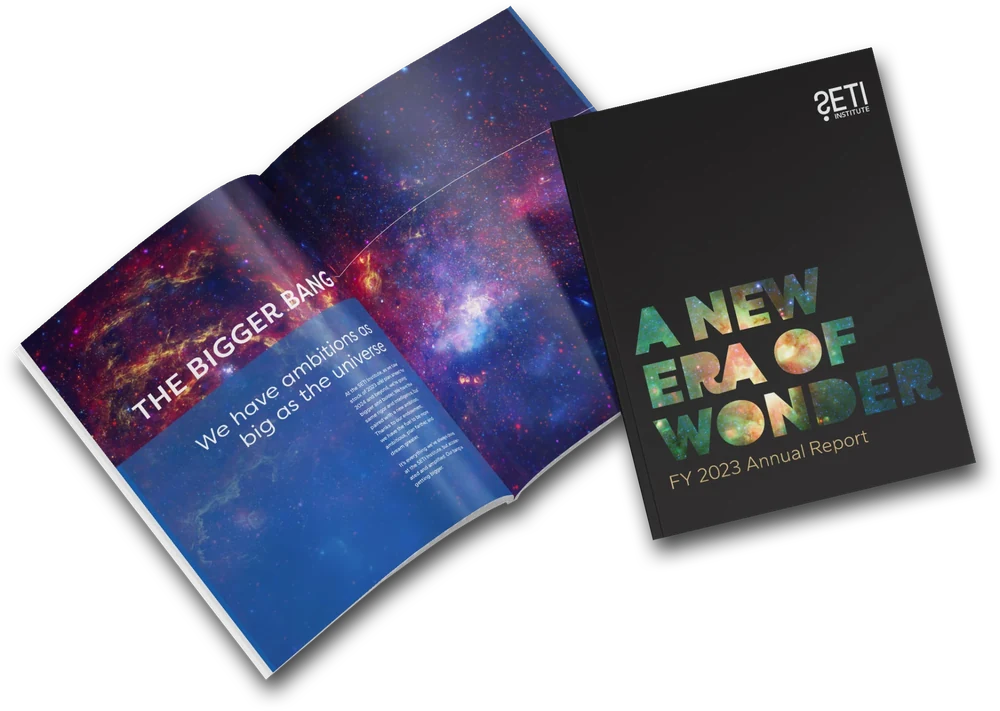
SETI Institute Annual Report
Dense research and financial content designed into a readable print and digital report.
View Case Study
IFS Industries Website
Technical manufacturing content structured for buyers, partners, and specifiers.
View Case Study
Mary Tyler Moore Website
Visual system and resource platform supporting ongoing research reporting.
View Case StudySustainability Report Design.
Clear, Credible, Complete.
Hooten Design is an editorial design studio that designs sustainability and ESG reports for companies, foundations, and institutions. Work covers narrative structure, data visualization for disclosure metrics, print production, and accessible digital editions. Most projects run eight to fourteen weeks.
Sustainability and ESG reports fail in two directions. Either they read as marketing, which invites skepticism, or they arrive as a wall of disclosure tables nobody outside the compliance team can use. Good design solves both problems at once by separating the narrative layer from the data layer and giving each one the treatment it needs.
We design these reports as editorial documents. A clear structure, restrained typography, honest photography, and charts built so one metric makes one point. Emissions figures, energy and water data, workforce numbers, supply chain progress, and governance detail all get laid out so a reader can find what they came for and understand it.
As an ESG report design agency, we pay the most attention to the numbers. Scope 1, 2, and 3 emissions get consistent baselines and units. Targets sit next to progress. Year-over-year comparisons use the same chart style every time, so readers can trust what they are looking at.
An interactive ESG report can give each topic its own page, let readers compare years, and keep the complete disclosure tables one download away. We design and build the web edition alongside the PDF, with shared chart styles and the same approved figures in both.
We work with companies, manufacturers, foundations, and research institutes across the US as a CSR and sustainability report design firm. Three decades of editorial and reporting design sit behind the work, including the SETI Institute annual report and long-running publishing programs for organizations in science, industry, and advocacy.
Reporting on program outcomes instead of environmental metrics? See impact report design. For a traditional fiscal-year publication, see annual report design.
Charts and disclosure tables need to work in the PDF too. Our guide to making an accessible PDF in InDesign and Acrobat explains the preparation, export settings, and manual checks.
Structure, Data,
and Production
Report Structure & Narrative
Section architecture that separates strategy, progress, and disclosure, so the report serves investors, customers, and regulators at once.
Disclosure Data Visualization
Emissions, energy, water, waste, workforce, and supply chain metrics turned into charts and tables built for comparison year over year.
Editorial Design & Layout
Typography, grid, and pacing that hold long-form narrative and dense appendix data in one coherent document.
Art Direction & Photography
Documentary-leaning photography direction and illustration that shows real operations rather than generic imagery.
Interactive ESG Report Websites
Online report microsites with interactive data views, downloadable tables, and tagged accessible PDFs sized for download and search visibility.
Framework-Aware Layout
Layouts and index pages designed to accommodate GRI, SASB, TCFD, and CSRD style content your reporting team supplies.
What Sets Us Apart
Research Before Design
Audience, market, and business goals guide the work before visual concepts begin.
Senior Design and Engineering
Experienced designers and engineers work together from early decisions through launch.
Recognizable Client Work
Our clients include SETI Institute, BlueStar, adidas, Fjällräven, and the Michael J. Fox Foundation.
One Accountable Partner
Strategy, brand, design, and engineering stay with the same team.
Built for Remote Collaboration
We work across US time zones and internationally, using clear reviews and direct access to the team.
How It Works
How a SustainabilityReport Project Runs
Five stages, scheduled backward from your publication date.
- 01
Scope and structure
We agree on section architecture, page count, formats, which frameworks the content follows, and the publication deadline.
DELIVERABLE: Report outline and scope
- 02
Content and data intake
We take in metrics, methodology notes, narrative drafts, and photography, then flag gaps and inconsistencies before layout begins.
DELIVERABLE: Content inventory and gap list
- 03
Art direction and design
Two editorial directions using real content, then full layout with custom charts, data tables, and photo editing.
DELIVERABLE: Design directions and full layout
- 04
Review and verification support
Two structured revision rounds with consolidated stakeholder feedback, plus proofreading and a data check against your source figures.
DELIVERABLE: Approved final layout
- 05
Production and release
Prepress and print coordination where a print run is needed, plus the tagged accessible PDF and web edition.
DELIVERABLE: Print files and digital edition
Interactive ESG Web Reports
& Microsites
Some readers want the full report. Others need one emissions chart or a link to a policy. Sustainability report website design should serve both without making either audience hunt.
Online Report Structure
Separate pages for strategy, environmental performance, people, and governance, with direct links to each topic and a clear route to the full PDF.
Interactive ESG Data
Year and category filters where they help a comparison, with visible units, baseline years, methodology notes, and readable tables alongside charts.
PDF and Web Together
One approved set of figures and a shared visual system across the downloadable report and website. Changes are checked in both editions before release.
Mobile and Accessible Reading
Readable tables, keyboard-operable controls, chart descriptions, and meaningful headings planned into the web edition, with manual testing included in the agreed scope.
CSR Report Websites
Program stories and responsibility data organized for customers, employees, and partners, with supporting evidence close to the claims it explains.
Publication and Future Updates
A plan for review, launch, archives, and the next reporting year, including who owns content changes after publication.
Common Questions
Related Design Services
Sustainability reporting work often runs alongside these engagements.
Ready to Publish
a Report That Holds Up?
Tell us about the report, the frameworks it follows, and the publication date. We will come back with scope and timing.
We use cookies for analytics so we can understand how visitors use this site. You can opt out at any time below or via the footer. See our Privacy Policy.